Emily Dirsh
Leading UX Strategy Together: Crafting Clarity out of Complexity with Collaborative Problem-Solving
emily.dirsh@gmail.com
|
978-666-4494
|
https://linkedin.com/in/emilydirsh
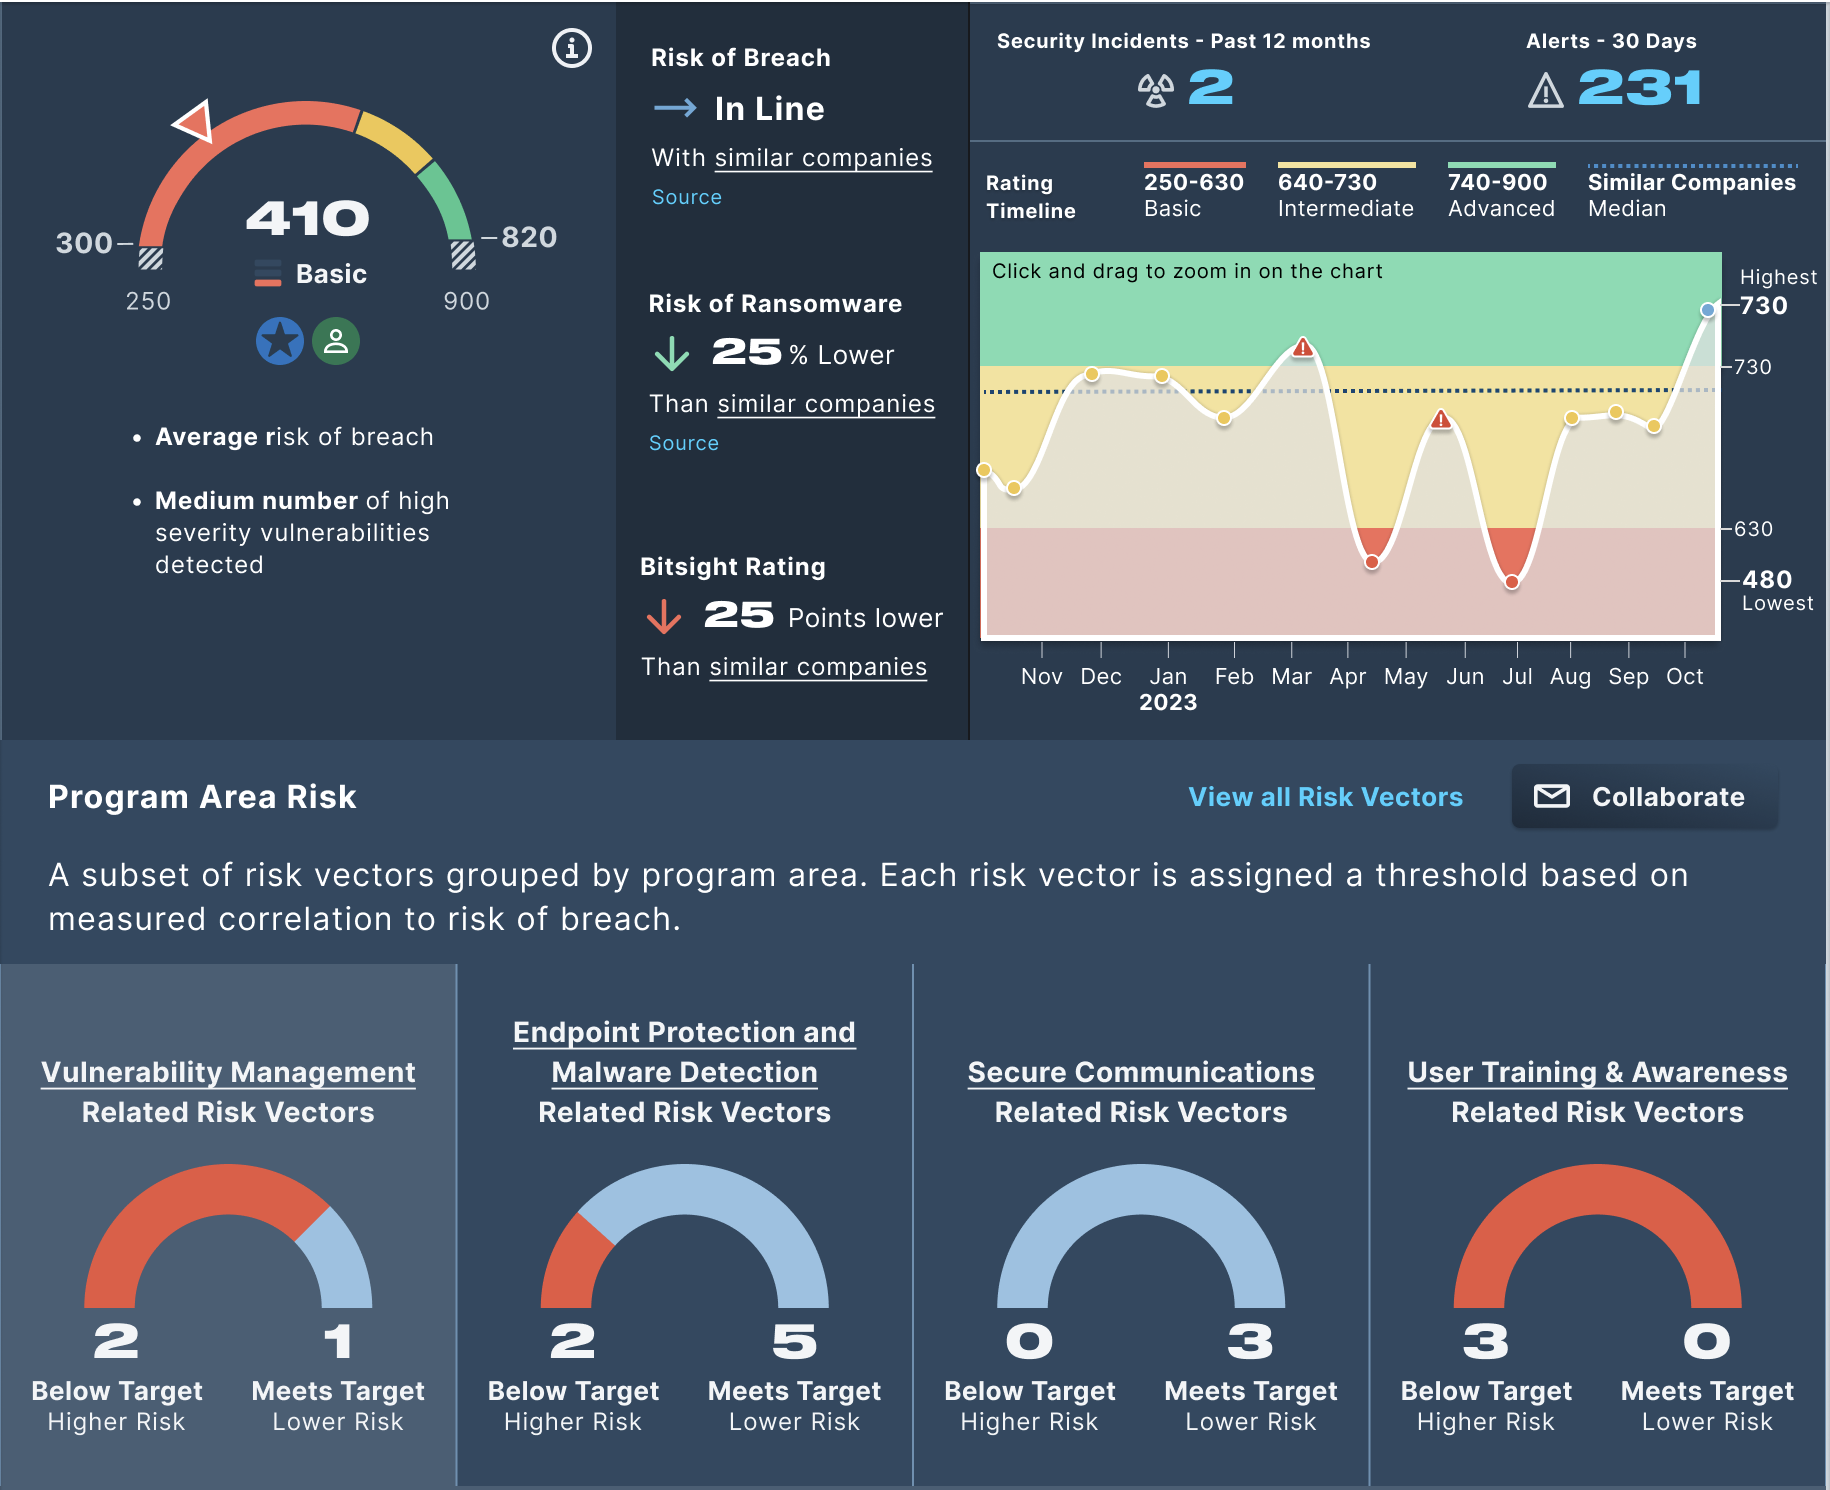
Vendor Overview
A comprehensive overview of cybersecurity risk for a given vendor.
Vision
Why did we do this?
Strategic Objective
This was a perfect storm of a highly used page, rated extremely poorly for user satisfaction. One of the oldest pages in the application, over the years it had become a veritable junk drawer for the product.
A rebranding effort was the perfect opportunity to put resources towards redoing the page cleanly.
We conducted research to understand what users expected, wanted, and needed from the page; what existing information was critical; and what was no longer useful. Then we redesigned and rebuilt the page from a blank slate, incorporating the updated branding in the final visual styling.
Problem
Users evaluate and monitor many vendors. They have to spend a good amount of time per vendor to have a good grasp of the potential business risk for a given vendor.
Regardless of their conclusions, they do not themselves make decisions about whether to onboard or renew a vendor. Therefore, they need to communicate their findings in a persuasive way to those in a position to make decisions: a mostly non-technical audience.
Target User
Compliance analysts and IT professionals specializing in vendor risk analysis, alongside potential non-technical audiences outside of the application.
Desired Outcome
A page which balances clarity, accuracy, and the holistic evaluation of cyber risk; adding in enough context and business risk framing to allow a non-technical audience to comprehend the risk posed by a vendor.
Outcomes
What did we do?
Solutions
Our security rating is modeled after a credit rating. And similar to a credit rating, it requires some experience to properly understand what the rating actually means.
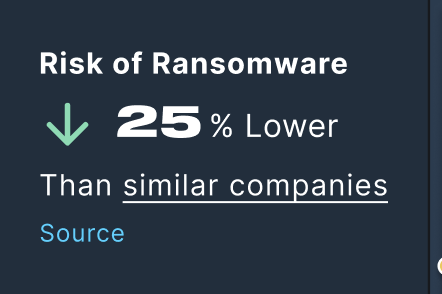
We added comparative context to properly frame the rating number, using an algorithm that identifies similar companies, so that the comparison is as relevant as possible.
We reframed detailed rating breakdown in terms of business risk, to better pinpoint areas that are relevant to the relationship and product the vendor provides.
We provided interaction with the data where needed, so that analysts could quickly access more details without compromising the nature of the page.
Provide comparative context to frame the security peformance rating
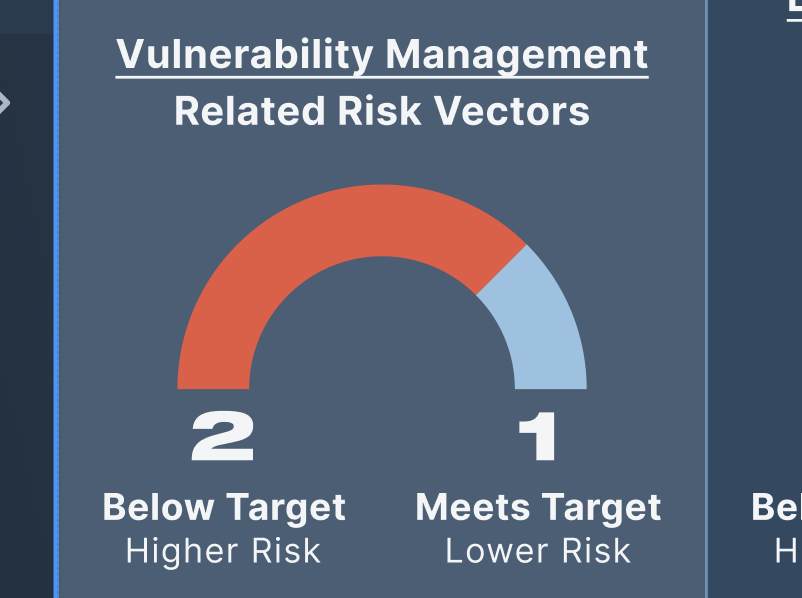
Frame rating breakdown as business risk
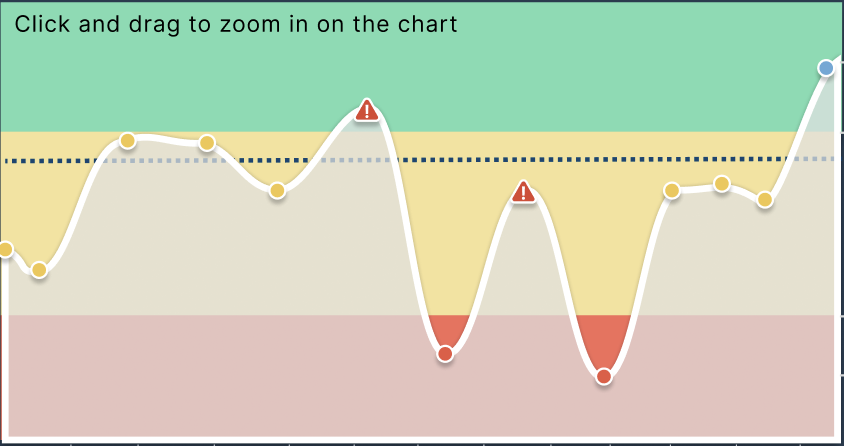
Add interactive charts where relevant to allow progressive disclosure of details
User Outcomes
We saw a 37% increase in user satisfaction ratings post-launch, 24% less time spent on average on the page, and increased funnel usage to other parts of the product.
Implementation
How did we do it?
Process

User Interviews
+ Card Sort
Interview compliance specialists and IT professionals on vendor risk assessment needs.
Card sort current page content to understand users attitude to existing information.
Data Science Consultin
Initial consultation with data science to better understand potential for various kinds of risk analysis.
Concept Development
Collaborate with data science and product management to develop testable concepts.
Concept Testing
Test low-fidelity concepts with users.
Concept Finalization
Iterate on concepts, incorporating testing results and feedback, along with regular reviews with Data Science and Engineering representatives to ensure concepts are achievable.
Visual Styling
Convert low-fidelity concepts into high-fidelity mockups with visual styling that matches the updated branding.
Implementation
Support engineering through implementation phase.
Launch
Assist product management and content managers in launch tasks and supporting content.
Post-launch Analytics and Feedback
Analyze post-launch metrics and user feedback.
Post-launch updates
Update to fix identified usability issues and clean up some interactions and language
Wrong Turns
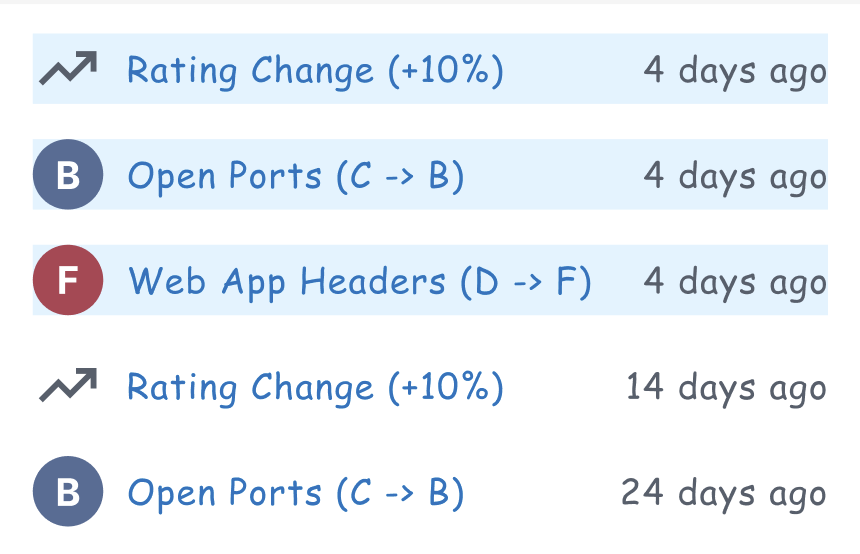
The event log got mixed reviews and was ultimately dropped.
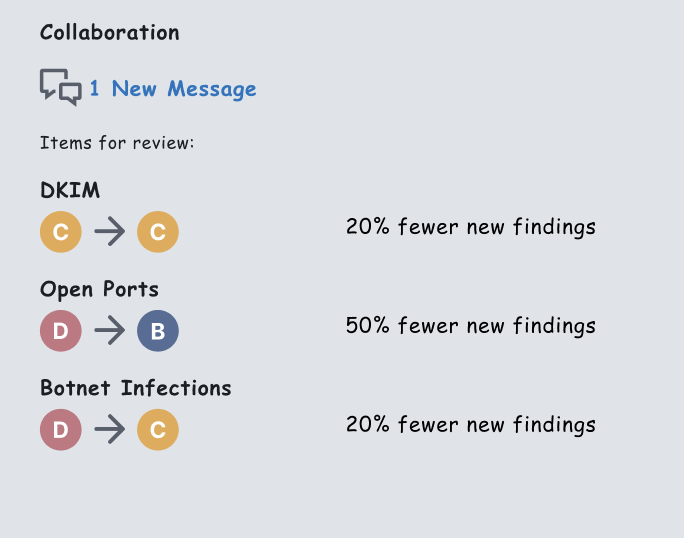
The collaboration tile was moved to the sidebar for better organization.
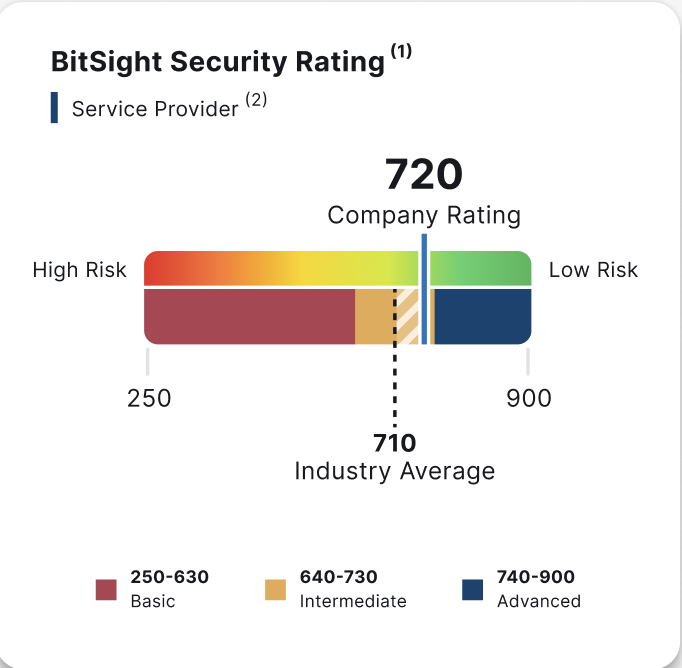
The rating gauge was deemed too cluttered for this page.
Teams
- Data Science
- Product Management
- UXD
- Sales
- Content Management
Emily Dirsh
Leading UX Strategy Together: Crafting Clarity out of Complexity with Collaborative Problem-Solving
emily.dirsh@gmail.com
|
978-666-4494
|
https://linkedin.com/in/emilydirsh
Vendor Overview
A comprehensive overview of cybersecurity risk for a given vendor.
Vision
Why did we do this?
Strategic Objective
This was a perfect storm of a highly used page, rated extremely poorly for user satisfaction. One of the oldest pages in the application, over the years it had become a veritable junk drawer for the product.
A rebranding effort was the perfect opportunity to put resources towards redoing the page cleanly.
We conducted research to understand what users expected, wanted, and needed from the page; what existing information was critical; and what was no longer useful. Then we redesigned and rebuilt the page from a blank slate, incorporating the updated branding in the final visual styling.
Problem
Users evaluate and monitor many vendors. They have to spend a good amount of time per vendor to have a good grasp of the potential business risk for a given vendor.
Regardless of their conclusions, they do not themselves make decisions about whether to onboard or renew a vendor. Therefore, they need to communicate their findings in a persuasive way to those in a position to make decisions: a mostly non-technical audience.
Target User
Compliance analysts and IT professionals specializing in vendor risk analysis, alongside potential non-technical audiences outside of the application.
Desired Outcome
A page which balances clarity, accuracy, and the holistic evaluation of cyber risk; adding in enough context and business risk framing to allow a non-technical audience to comprehend the risk posed by a vendor.
Outcomes
What did we do?
Solutions
Our security rating is modeled after a credit rating. And similar to a credit rating, it requires some experience to properly understand what the rating actually means.
We added comparative context to properly frame the rating number, using an algorithm that identifies similar companies, so that the comparison is as relevant as possible.
We reframed detailed rating breakdown in terms of business risk, to better pinpoint areas that are relevant to the relationship and product the vendor provides.
We provided interaction with the data where needed, so that analysts could quickly access more details without compromising the nature of the page.
Provide comparative context to frame the security peformance rating
Frame rating breakdown as business risk
Add interactive charts where relevant to allow progressive disclosure of details
User Outcomes
We saw a 37% increase in user satisfaction ratings post-launch, 24% less time spent on average on the page, and increased funnel usage to other parts of the product.
Implementation
How did we do it?
Process
User Interviews
+ Card Sort
Interview compliance specialists and IT professionals on vendor risk assessment needs.
Card sort current page content to understand users attitude to existing information.
Data Science Consult
Initial consultation with data science to better understand potential for various kinds of risk analysis.
Concept Development
Collaborate with data science and product management to develop testable concepts.
Concept Testing
Test low-fidelity concepts with users.
Concept Finalization
Iterate on concepts, incorporating testing results and feedback, along with regular reviews with Data Science and Engineering representatives to ensure concepts are achievable.
Visual Styling
Convert low-fidelity concepts into high-fidelity mockups with visual styling that matches the updated branding.
Implementation
Support engineering through implementation phase.
Launch
Assist product management and content managers in launch tasks and supporting content.
Post-launch Analytics and Feedback
Analyze post-launch metrics and user feedback.
Post-launch updates
Update to fix identified usability issues and clean up some interactions and language
Wrong Turns
The event log got mixed reviews and was ultimately dropped.
The collaboration tile was moved to the sidebar for better organization.
The rating gauge was deemed too cluttered for this page.
Teams
- Data Science
- Product Management
- UXD
- Sales
- Content Management